OVERVIEW
One of the other initial interpretations that needs to be made on a electrocardiogram (EKG/ECG) is in regards to the axis of the heart. The central question that is answered here is whether or not the axis of the heart has deviated from its normal position (either to the right or the left).
AXIS OF HEART’S ELECTRICAL ACTIVITY
After calculating the rate and the rhythm, we can determine the axis of the heart’s electoral activity (in essence, what direction is MOST of the heart’s electrical activity going). This also is an important clinical descriptor because it can help character underlying clinical biology (i.e. left ventricular hypertrophy can cause left axis deviation).
Based upon the specific positions of the limb leads (see below) we can help characterize the heart’s axis.
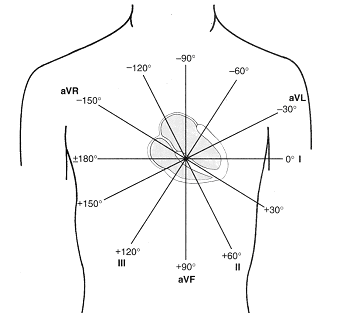
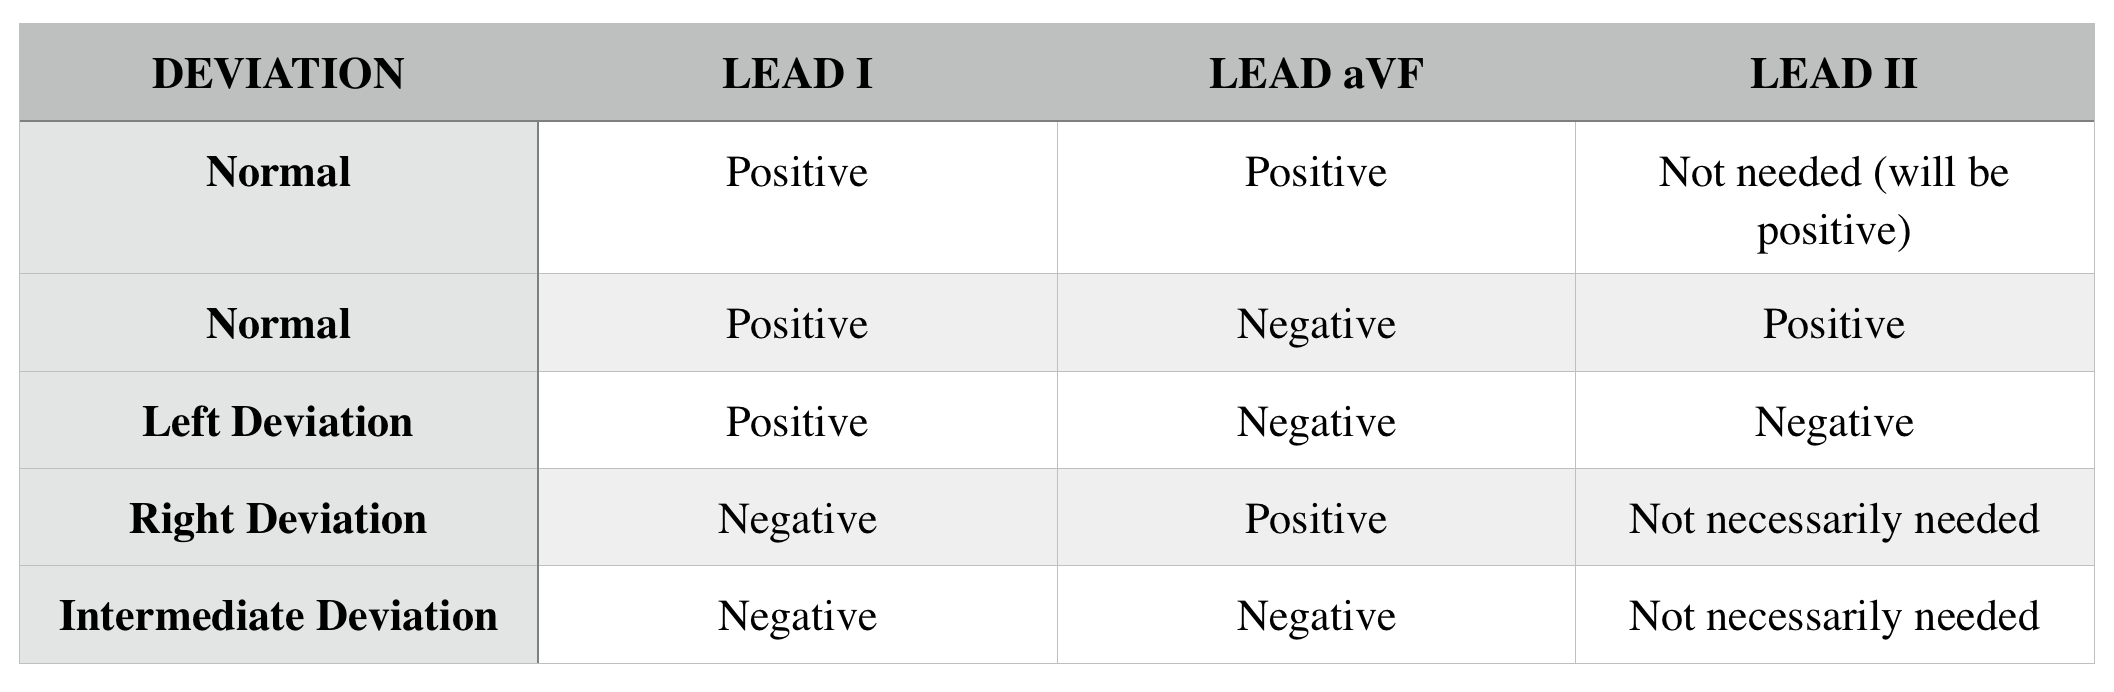
Lets keep in mind that lead I marks the 0° position on the left side of the heart, and AVF points towards the feet of the individual (and marks the 90° position). The normal axis is from +90° to -30°. The below is a quick summary of common lead findings and their respective heart deviations.
EXAMPLES OF NORMAL AXIS DEVIATION
Below are examples of EKGs that have normal axis deviation. Remember if leads I and aVF are both positive you can conclude that the axis is normal (and Lead II will be positive always). If lead I is positive and lead aVF is negative, then looking at lead II will help determine if the axis is normal (provided lead II is also positive).


EXAMPLES OF LEFT AXIS DEVIATION
Below are examples of EKGs that have left axis deviation. Remember if lead I is positive, and both leads aVF and lead II are negative then there is left axis deviation.


Page Updated: 03.05.2018