Page Contents
OVERVIEW
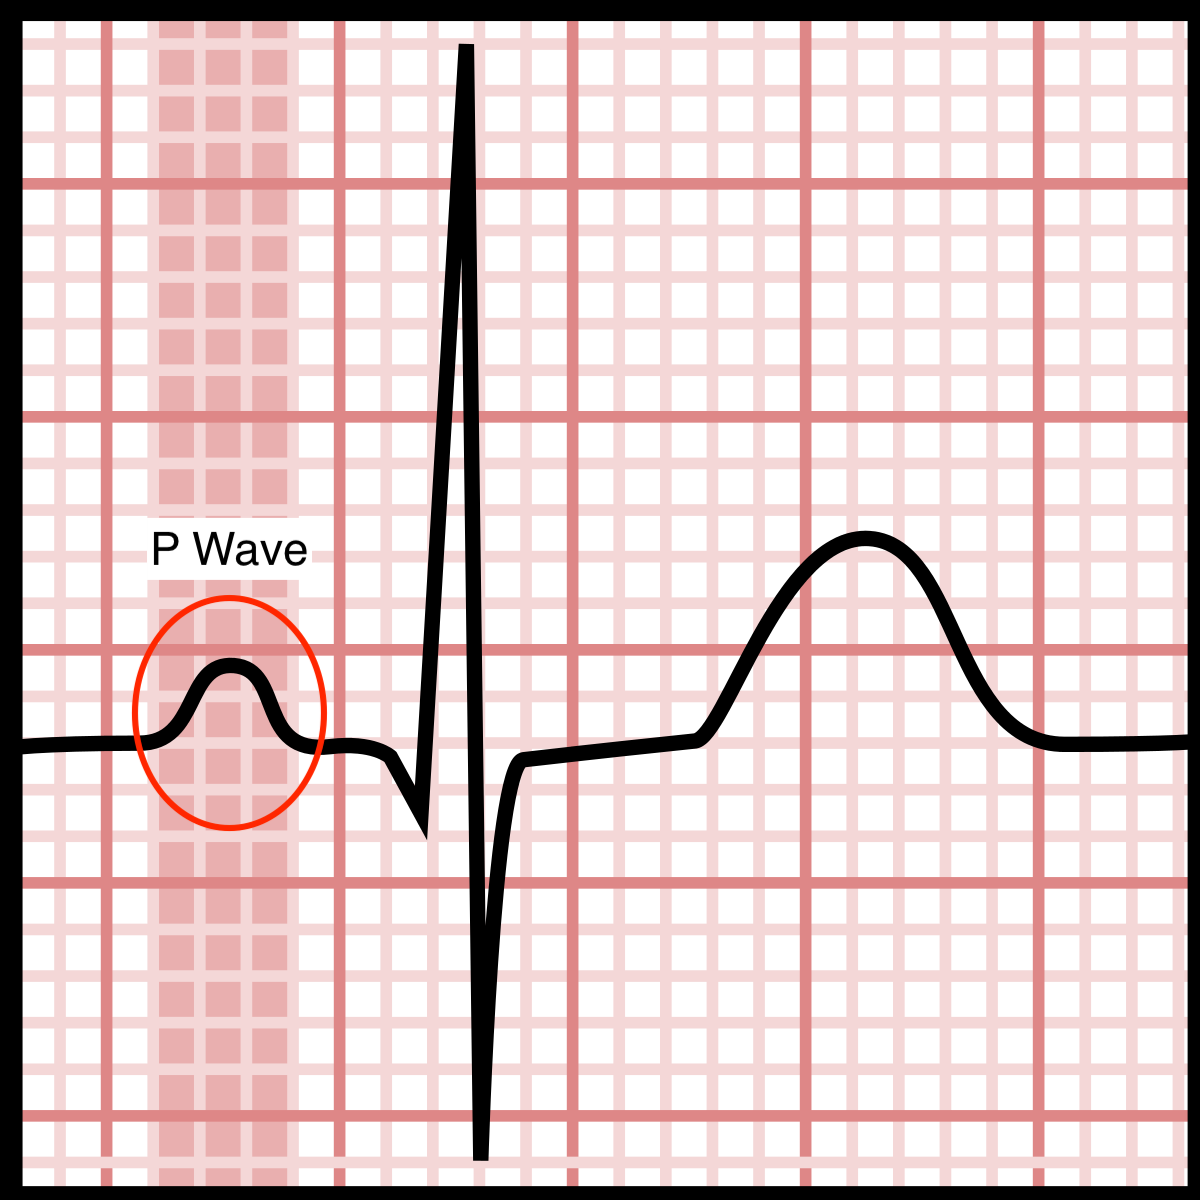
Because of their importance in deterring the rhythm of a patient (such as sinus rhythm) and their importance in identifying pathology, evaluating the P waves on a electrocardiogram (EKG/ECG) should be done early on during its interpretation. As explained on the page concerning the basic components of an EKG tracing, the p wave corresponds to atrial contraction/depolarization.
DETECTING P WAVES: ARE THE PRESENT OR ABSENT
When evaluating P waves, the first question to ask is if they are present or not. Typically one should look at the leads I, II, III and V1 to see p waves (sometimes V1 is the lead on which to most easily detect P waves). It is important to appreciate that the morphology of the p wave will vary depending upon which lead you look at (lead II and V1 for example often times have very different looking p waves), however this will be discussed more in detail below in the “morphology of p waves” section. Initially we must make a binary assessment about whether or not the p wave is absent or present.
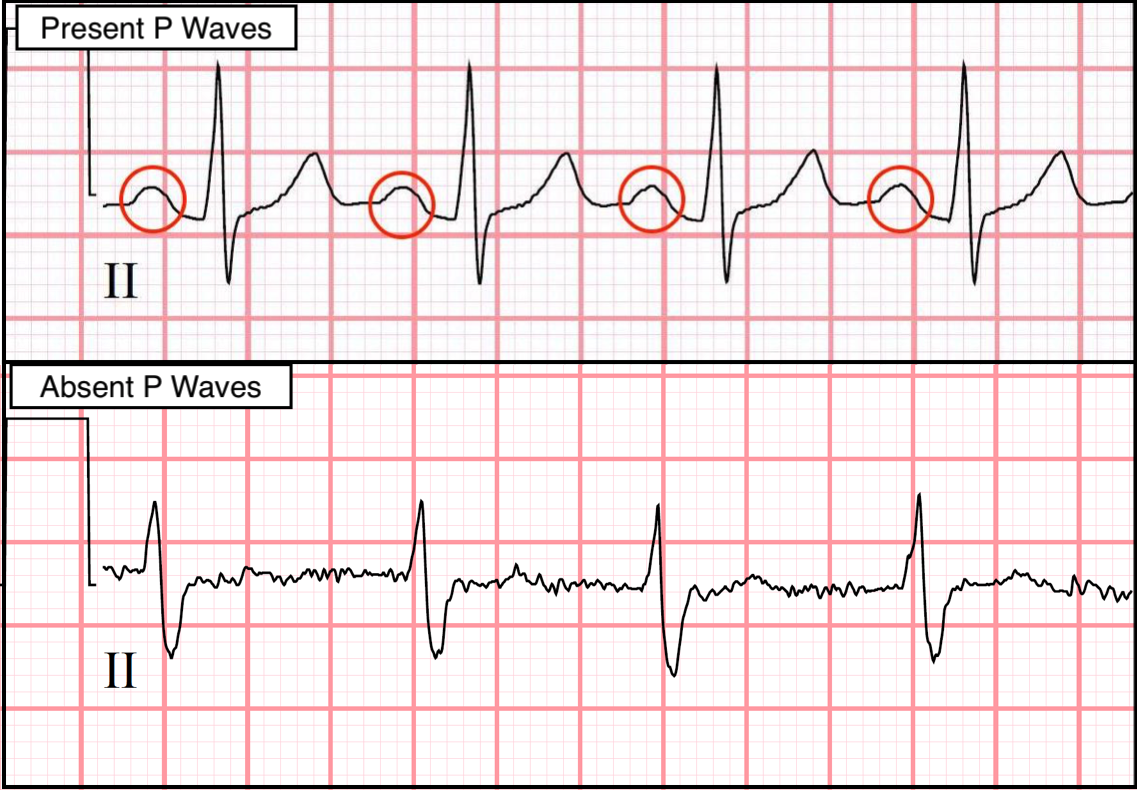
If no p waves can be detected already this finding has its own differential of diagnosis (explained more here) and can be highly suggestive that the patient has atrial fibrillation. Contrastingly, if P waves are present a few more characteristics should be noted to fully evaluate them (see sections below).
Examples Of Present P Waves:
Bellow is a gallery of examples of various leads with present P waves. This is an opportunity to being to appreciate how variable P waves can appear (especially across leads). It is also an opportunity to practice quickly identifying their presence. CLICK ON THE THUMBNAILS BELOW TO OPEN UP THIS IMAGE GALLERY.


Examples Of Absent P Waves:
Bellow is a gallery of examples of various leads with absent P waves. This is an opportunity to being to appreciate what the true absence of P waves looks like on an EKG. CLICK ON THE THUMBNAILS BELOW TO OPEN UP THIS IMAGE GALLERY.


DETERMING IF THE P WAVE IS COMING FROM THE SINOATRIAL (SA) NODE
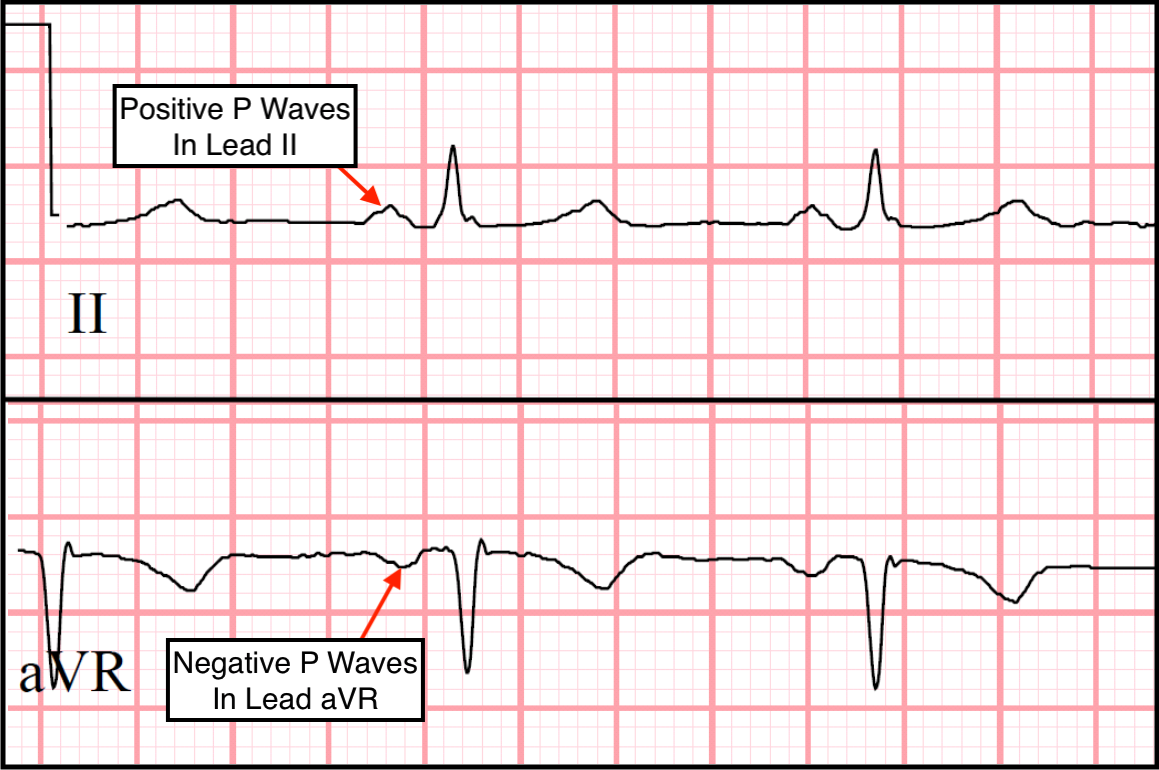
If p waves are present, one can quickly determine if the p waves are originating from the SA node. This is part of criteria for determining if the patient has sinus rhythm (discussed more here) and can be quickly done when first looking at P waves. While this may seem complicated, making this determination is actually quite simple, and only two real criteria need to be met to determine if a patients P waves: 1.) The p waves are positive in lead II 2.) The P waves are negative in lead aVR.
Why Does This Pattern Suggest That The P Waves Are Coming From the SA Node?
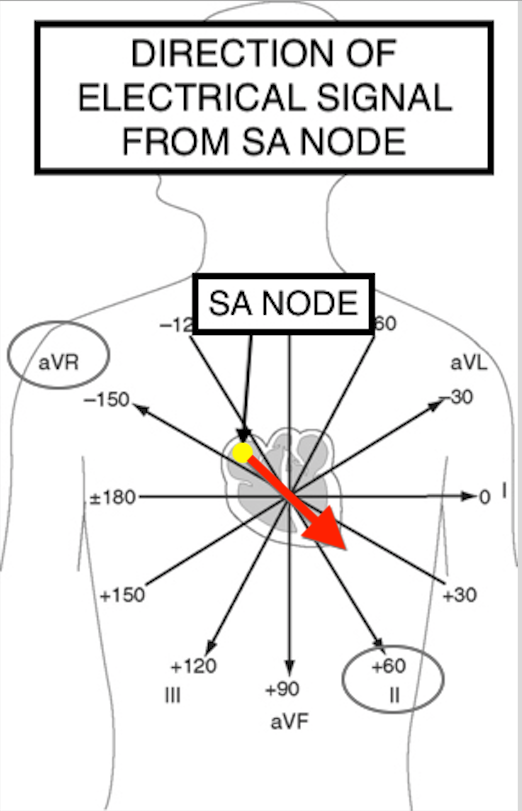
The anatomical location of the SA node, the location of the limb leads, and the basic science behind how an EKG works all help to understand why the pattern described above help suggest that the P waves are originating from the SA node. It may be useful to review how EKGs work and the placement locations of EKG leads.
Fundamentally, the SA node will fire an electrical signal that will travel down the heart and begin the process of atrial and ventricular contraction. The path that this signal takes will be directly away from lead aVR (causing a negative P wave in this lead) and directly toward lead II (resulting in a positive P wave in this lead). The diagram below helps to illustrate this.
Examples Of P Waves That Originate From The SA Node:
Bellow is a gallery of examples of various leads with present P waves that originate from the SA node. This is an opportunity to being to appreciate how variable to quickly identify that a P wave is positive in lead II and negative in aVR for those who have P waves coming from the SA node. CLICK ON THE THUMBNAILS BELOW TO OPEN UP THIS IMAGE GALLERY.


MORPHOLOGY OF P WAVES: VARIATIONS BY LEAD
As alluded to previously, the morphology of a P wave will actually change based upon the lead that is being evaluated. This section will try to cover how P waves will appear differently on various leads.
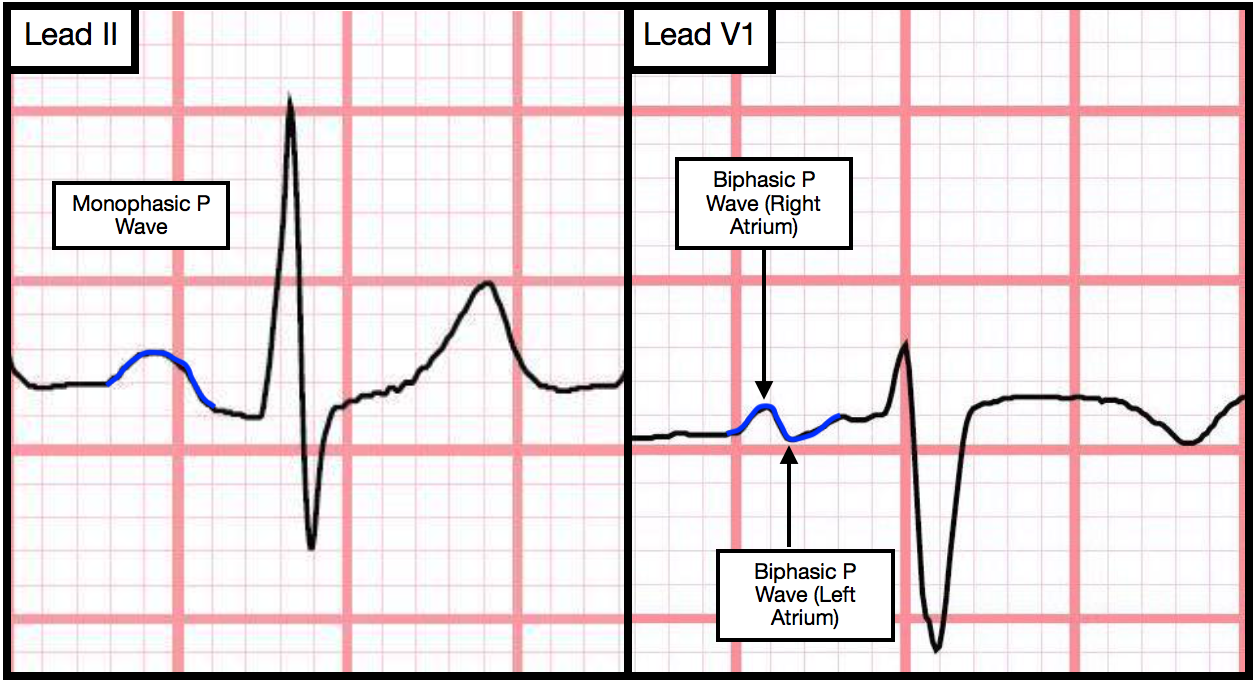
Appearance Of P Waves On Lead II
Bellow is a gallery of examples showing the mon0phasic appearance of P waves on lead II. It is important to appreciate this classic appearance, but also understand that other non-pathological morphologies of P waves on this lead are common as well. CLICK ON THE THUMBNAILS BELOW TO OPEN UP THIS IMAGE GALLERY.


Appearance Of P Waves On Lead V1
Bellow is a gallery of examples showing the mon0phasic appearance of P waves on lead V1. It is important to appreciate this classic appearance, but also understand that other non-pathological morphologies of P waves on this lead are common as well. CLICK ON THE THUMBNAILS BELOW TO OPEN UP THIS IMAGE GALLERY.


MORPHOLOGY OF P WAVES: PATHOLOGY
Page Updated: 03.07.2018